Note
Go to the end to download the full example code.
Pairwise functional alignment.
In this tutorial, we show how to better predict new contrasts for a target subject using source subject corresponding contrasts and data in common.
We mostly rely on python common packages and on nilearn to handle functional data in a clean fashion.
To run this example, you must launch IPython via ipython
--matplotlib in a terminal, or use jupyter-notebook.
Retrieve the data
In this example we use the IBC dataset, which include a large number of different contrasts maps for 12 subjects. We download the images for subjects sub-01 and sub-02 (or retrieve them if they were already downloaded) Files is the list of paths for each subjects. df is a dataframe with metadata about each of them. mask is an appropriate nifti image to select the data.
[get_dataset_dir] Dataset found in /home/runner/nilearn_data/ibc
Define a masker
We define a nilearn masker that will be used to handle relevant data. For more information, consult Nilearn’s documentation on masker objects.
from nilearn.image import concat_imgs
from nilearn.maskers import MultiNiftiMasker

masker = MultiNiftiMasker(mask_img=mask).fit()
Prepare the data
For each subject, for each task and conditions, our dataset contains two independent acquisitions, similar except for one acquisition parameter, the encoding phase used that was either Antero-Posterior (AP) or Postero-Anterior (PA).
Although this induces small differences in the final data, we will take advantage of these “duplicates to create a training and a testing set that contains roughly the same signals but acquired totally independently.
# The training fold, used to learn alignment from source subject toward target:
# * source train: AP contrasts for subject sub-01
# * target train: AP contrasts for subject sub-02

source_train_imgs = concat_imgs(
    df[(df.subject == "sub-01") & (df.acquisition == "ap")].path.values
)
target_train_imgs = concat_imgs(
    df[(df.subject == "sub-02") & (df.acquisition == "ap")].path.values
)

# The testing fold:
# * source test: PA contrasts for subject sub-01, used to predict
#   the corresponding contrasts of subject sub-02
# * target test: PA contrasts for subject sub-02, used as a ground truth
#   to score our predictions

source_test_imgs = concat_imgs(
    df[(df.subject == "sub-01") & (df.acquisition == "pa")].path.values
)
target_test_imgs = concat_imgs(
    df[(df.subject == "sub-02") & (df.acquisition == "pa")].path.values
)
Generate a parcellation from the images
We will compute the alignment in a piecewise manner, that is, we will align
the data in small parcels of the brain, which are groups of functionally
similar voxels. To do so, we need to generate a parcellation of the
functional data. We use the get_labels
utility, which will generate a parcellation of the data in 150 pieces.
from fmralign.embeddings.parcellation import get_labels

labels = get_labels(
    imgs=[source_train_imgs, target_train_imgs],
    n_pieces=150,
    masker=masker,
)
/home/runner/work/fmralign/fmralign/fmralign/embeddings/parcellation.py:114: UserWarning: Converting masker to multi-masker for compatibility with Nilearn Parcellations class. This conversion does not affect the original masker. See https://github.com/nilearn/nilearn/issues/5926 for more details.
  warnings.warn(
/home/runner/work/fmralign/fmralign/fmralign/embeddings/parcellation.py:134: UserWarning: Overriding provided-default estimator parameters with provided masker parameters :
Parameter mask_strategy :
    Masker parameter background - overriding estimator parameter epi
Parameter smoothing_fwhm :
    Masker parameter None - overriding estimator parameter 4.0

  parcellation.fit(images_to_parcel)
/home/runner/work/fmralign/fmralign/.venv/lib/python3.12/site-packages/sklearn/cluster/_agglomerative.py:324: UserWarning: the number of connected components of the connectivity matrix is 35 > 1. Completing it to avoid stopping the tree early.
  connectivity, n_connected_components = _fix_connectivity(
Define the estimator, fit it and predict
To proceed with the alignment we use
PairwiseAlignment,
which implements various functional alignment methods between data from two subjects.
In this example, we use the Procrustes method.
Since we want to align the data in parcels,
we pass the labels we just computed to the estimator.
The labels are used to compute the alignment in each parcel separately,
and then to aggregate the local transformations into a global
transformation that is applied to the whole brain.
from fmralign import PairwiseAlignment

(source_train_data, target_train_data, source_test_data, target_test_data) = (
    masker.transform(
        [
            source_train_imgs,
            target_train_imgs,
            source_test_imgs,
            target_test_imgs,
        ]
    )
)

alignment_estimator = PairwiseAlignment(method="procrustes", labels=labels)
# Learn alignment operator from subject 1 to subject 2 on training data
alignment_estimator.fit(source_train_data, target_train_data)
# Predict test data for subject 2 from subject 1
target_pred_data = alignment_estimator.transform(source_test_data)
/home/runner/work/fmralign/fmralign/examples/plot_pairwise_alignment.py:116: FutureWarning: boolean values for 'standardize' will be deprecated in nilearn 0.15.0.
Use 'zscore_sample' instead of 'True' or use 'None' instead of 'False'.
  masker.transform(
/home/runner/work/fmralign/fmralign/fmralign/alignment/utils.py:210: UserWarning:
 Some parcels are more than 1000 voxels wide it can slow down alignment,especially optimal_transport :
 parcel 8 : 1062 voxels
 parcel 9 : 1393 voxels
 parcel 12 : 1313 voxels
 parcel 23 : 1210 voxels
 parcel 31 : 1712 voxels
 parcel 50 : 1223 voxels
  warnings.warn(warning)
Score the baseline and the prediction
We use a utility scoring function to measure the voxelwise correlation between the prediction and the ground truth. That is, for each voxel, we measure the correlation between its profile of activation without and with alignment, to see if alignment was able to predict a signal more alike the ground truth.
from fmralign.metrics import score_voxelwise

# Now we use this scoring function to compare the correlation of aligned and
# original data from sub-01 made with the real PA contrasts of sub-02.

baseline_score = score_voxelwise(
    target_test_data, source_test_data, loss="corr"
)
aligned_score = score_voxelwise(
    target_test_data, target_pred_data, loss="corr"
)
Plotting the measures
Finally we plot both scores
from nilearn import plotting

baseline_score_img = masker.inverse_transform(baseline_score)
aligned_score_img = masker.inverse_transform(aligned_score)
baseline_display = plotting.plot_stat_map(
    baseline_score_img, display_mode="z", vmax=1, cut_coords=[-15, -5]
)
baseline_display.title("Baseline correlation wt ground truth")
display = plotting.plot_stat_map(
    aligned_score_img, display_mode="z", cut_coords=[-15, -5], vmax=1
)
display.title("Prediction correlation wt ground truth")
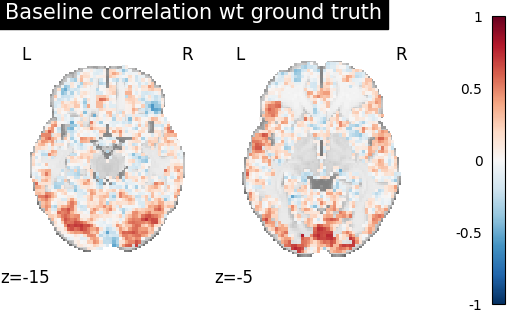
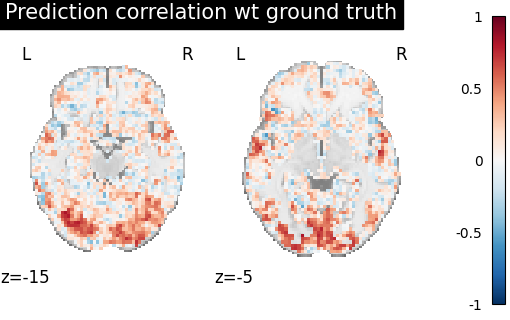
We can see on the plot that after alignment the prediction made for one subject data, informed by another subject are greatly improved.
Total running time of the script: (0 minutes 42.727 seconds)